

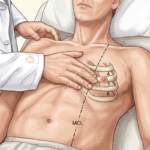




A 58-year-old lorry driver from Kundapura has alcohol-related cirrhosis. He stopped drinking a year ago. He has a large umbilical hernia that has started to ache, and the surgeon wants to repair it before it strangulates. On the ward you find mild ascites, an albumin of 2.9 g/dL, a bilirubin of 1.8 mg/dL and a platelet count of 88,000. His Body Mass Index is 27. The surgeon’s note says: “Physician opinion please. Fit for surgery?” This is an illustrative case, not a real patient.
Most of us have answered that note with a Child-Turcotte-Pugh class and a MELD score. By the end of this article you will know why neither was built for the question, what the VOCAL-Penn score adds, and which parts of this man’s risk no model can see.
Use this at the bedside
Open the tool: VOCAL-Penn Surgical Risk Score
Get the CDSS app: install the MEDiscuss CDSS on your phone
1. The old scores describe the liver, not the operation
Start with where our usual scores came from.
MELD was derived to predict survival after a transjugular intrahepatic portosystemic shunt and then adopted for transplant allocation. Child-Turcotte-Pugh was a bedside classification from 1964 with two subjective items in it. Both describe the liver, and neither knows what operation is planned.
“But a sicker liver must mean a riskier operation?” It does. The trouble is that the operation matters too, and the old scores cannot see it. In the VOCAL-Penn data, an open abdominal procedure carries an odds ratio of about 4.8 for 30-day mortality against a laparoscopic one, before anything about the patient is considered. An odds ratio of 4.8 means the odds of death are nearly five times higher, for the same liver.
2. Does the new score do better?
The VOCAL-Penn models were built for exactly this question: a patient with cirrhosis, a named operation, and the risk of death or decompensation afterwards. A model is only as good as its performance in patients it has never seen, so the external validation matters most. A C-statistic is the chance that the model gives a higher risk to the patient who died than to one who survived; 0.5 is a coin toss and 1.0 is perfect.
- External validation, two health systems. C-statistic 0.82 for 90-day mortality, against 0.79 for the Mayo score, 0.79 for MELD and 0.78 for MELD-sodium. The differences were not significant. Calibration separated them: the Mayo score overestimated risk throughout, and VOCAL-Penn held its discrimination at higher MELD scores where MELD and MELD-sodium lost theirs.
Read that carefully. The C-statistics were close. What separated the scores was calibration: whether a predicted 20 per cent really meant about 20 deaths in a hundred. On that strength, the 2025 American College of Gastroenterology (ACG) guideline names VOCAL-Penn the preferred model, and states that MELD and Child-Turcotte-Pugh alone are inadequate for this decision.
3. Four models, not one
The calculator runs four logistic models. Three predict death at 30, 90 and 180 days, from the 2021 Hepatology paper. The fourth predicts decompensation by 90 days, from the 2022 Clinical Gastroenterology and Hepatology paper.
“Why is the 90-day figure never lower than the 30-day one? Aren’t they separate equations?” They are separate equations, but they are not separate questions. The 90-day model predicts death among those who survived the first 30 days. The tool joins the steps the way the paper does, so the 90-day figure includes the first month. Read alone, each equation would understate the later risk.
Decompensation is a different outcome: new clinically significant ascites, hepatic encephalopathy, hepatorenal syndrome or variceal bleeding within 90 days. Its model also held up in testing. C-statistic 0.766 in derivation and 0.762 in validation, against 0.663 for the Mayo score, 0.603 for MELD-sodium and 0.560 for Child-Turcotte-Pugh.
This is the figure that often decides where the patient goes after surgery. A man can carry a low risk of death and a high risk of decompensation. He is likely to survive, but he may come back from theatre with tense ascites or confusion, and that patient needs the high dependency unit, not the general ward.
One more thing surprises people the first time they see it. The four models do not share one list of predictors.
- The predictors differ between the four. Bilirubin is in the 30-day and the decompensation models only, age in three of the four but not the 30-day, obesity in the 30-day, the 180-day and the decompensation models. Each model kept whatever survived selection, so no single predictor list describes the tool.
So do not look for “the” VOCAL-Penn variables. Enter what the form asks for, and let each model take what it needs.
4. Reading the figure
A percentage is something you can say to a family. “High risk” gives them nothing to hold. A 90-day mortality they can hear, ask about, and weigh against what the operation offers.
There is one published threshold. The 2025 ACG guideline says to consider pre-operative liver transplant evaluation where the projected 90-day mortality reaches 15 per cent. The low and intermediate labels on the result cards are a display convention of the page, not a grading. Read the percentage.
The comparison table on the result is the most useful part for our patient. It re-runs the model with one input changed: elective against emergency, and open against laparoscopic for abdominal operations. For a man whose hernia may strangulate, the elective against emergency gap is the argument for operating now, in a planned way, rather than at midnight.
A common mistake, and an understandable one: reading the laparoscopic figure as what the patient would get if the surgeon switched approach. It is the model at a different input. The choice of approach rests on things this model knows nothing about.
5. What the model cannot see
Two patients with the same albumin, bilirubin and platelet count get the same number, whether one has tense ascites and the other has none. Ascites, encephalopathy, varices, sarcopenia, frailty, sodium, creatinine, the INR and hepatocellular carcinoma are absent from all four models. Uncontrolled ascites or encephalopathy is a reason to postpone an elective operation whatever the page reports. And ascites under an abdominal wall repair impairs wound healing directly: that is our patient.
“His BMI is 27. Is he obese?” By the Asian cut-off of 25 that the CDSS uses everywhere else, yes. To this model, no: it was fitted on the World Health Organization cut-off of 30. A BMI of 30 or above carries an odds ratio of 0.47 for 30-day mortality in the derivation data. That is an association, not a benefit of being heavier, and it sits beside sarcopenic obesity, which carries the opposite prognosis. The tool reads his BMI as the model requires, and flags the collision rather than hiding it.
6. The Indian picture
The derivation cohort was the United States Veterans Health Administration: mostly older, male and White. There is no published Indian validation. Until there is, quote the figure to an Indian family as an extrapolation, and say so.
Our cirrhosis is also different. A systematic review of 158 Indian studies puts alcohol at 43.2 per cent of adult cirrhosis, metabolic and cryptogenic disease at 14.4, hepatitis B at 11.5 and hepatitis C at 6.2, with alcohol commonest in every zone. The model carries only one aetiology term, MASLD against everything else. So our lorry driver, like most Indian patients, sits in the reference group by default.
What do Indian outcomes look like? There is one series to set beside the model.
- One Indian series, as context and not validation. The Institute of Liver and Biliary Sciences, New Delhi, followed 133 patients with cirrhosis through non-transplant surgery between 2009 and 2017. Observed mortality was 12 per cent at 30 days, 20.3 at 90 days and 26.3 at one year. A tertiary liver-institute case mix, analysed against the Mayo model rather than this one.
That series is a liver institute’s case mix, so do not use it as a prediction. Use it to remember that the American numbers are not the whole story.
Back to our patient
So what goes back in the surgeon’s file? Not “fit” or “unfit”. Enter his values, read the 90-day mortality and the decompensation risk, and look at the elective against emergency row. Then add what the model cannot see. Tap his ascites and send the fluid before an elective abdominal operation, because subclinical spontaneous bacterial peritonitis changes the plan. Control the ascites before the repair. Do not restrict his protein. Continue a non-selective beta blocker through the operation unless there is a contraindication. If the 90-day figure is high, ask where the repair should be done as well as whether: a transplant-capable centre changes what is possible if the liver decompensates.
Try this
A 49-year-old woman with MASLD cirrhosis is posted for an elective laparoscopic cholecystectomy. Her 90-day mortality on the tool comes out at 16 per cent. The surgeon asks whether doing it open would be safer, since “open is what we do for sick livers”. What do you say? Illustrative case.
Answer. Two things. First, at 16 per cent she has crossed the one published threshold: the ACG guideline says to consider pre-operative liver transplant evaluation at 15 per cent or more. Second, in this model open abdominal surgery carries an odds ratio of about 4.8 for 30-day mortality against laparoscopic, so the model gives no support to switching to open. The comparison row is the model at a different input, not a promise, but here it points the other way from the surgeon’s instinct.
Take-home points
- MELD and Child-Turcotte-Pugh describe the liver; they do not know the operation. The 2025 ACG guideline calls them inadequate alone for this decision.
- Read the 90-day mortality and the decompensation risk separately: the second often decides ward against high dependency unit.
- The only published threshold is a 90-day mortality of 15 per cent, which should prompt transplant evaluation.
- Ascites, encephalopathy, frailty and sarcopenia are invisible to the model; uncontrolled ascites or encephalopathy postpones an elective operation.
- There is no Indian validation: quote the figure as an extrapolation.
For the cardiac and general side of the same pre-operative round, see the queue’s article Pre-Surgical Risk: The Evidence Behind the Pathway. For how fibrosis is staged before cirrhosis is established, see FIB-4 and Elastography: The Evidence Behind the Thresholds.
Use this at the bedside
Open the tool: VOCAL-Penn Surgical Risk Score
Get the CDSS app: install the MEDiscuss CDSS on your phone
Declaration: the author built and maintains the tool. It is free to use. The figures in this article are those the tool carried in its Evidence tab on 5 November 2026, each from the source the tool names. The 16 per cent in “Try this” is illustrative, not a figure the tool printed; check the tool’s result for a real patient.
References
- Mahmud N, Fricker Z, Hubbard RA, Ioannou GN, Lewis JD, Taddei TH, Rothstein KD, Serper M, Goldberg DS, Kaplan DE. Novel risk prediction models for post-operative mortality in patients with cirrhosis. Hepatology. 2021;73(1):204-218. doi:10.1002/hep.31558
- Mahmud N, Fricker Z, Lewis JD, Taddei TH, Goldberg DS, Kaplan DE. Risk prediction models for post-operative decompensation and infection in patients with cirrhosis: a Veterans Affairs cohort study. Clin Gastroenterol Hepatol. 2022;20(5):e1121-e1134. doi:10.1016/j.cgh.2021.06.050
- Mahmud N, Fricker Z, Panchal S, Lewis JD, Goldberg DS, Kaplan DE. External validation of the VOCAL-Penn cirrhosis surgical risk score in 2 large, independent health systems. Liver Transpl. 2021;27(7):961-970. doi:10.1002/lt.26060
- Mahmud N, Fricker ZP, McElroy LM, Qayed E, Wong RJ, Ioannou GN. ACG clinical guideline: perioperative risk assessment and management in patients with cirrhosis. Am J Gastroenterol. 2025;120(9):1968-1984. doi:10.14309/ajg.0000000000003616
- Sierra L, Duong N. Surgery in cirrhosis: strategies for risk stratification and optimization. Evidence-Based GI, American College of Gastroenterology. September 2025.
- VOCAL Study Group, University of Pennsylvania. VOCAL-Penn Cirrhosis Surgical Risk Score. Reference calculator. https://www.vocalpennscore.com/ Accessed 23 August 2026.
- Johnson KM. Perioperative risk in patients with cirrhosis. Gastroenterol Hepatol (N Y). 2024;20(5).
- Subramanian KKK, Tandon M, Pandey CK, Jain P. Patients with cirrhosis of liver operated for non-transplant surgery: a retrospective analysis. J Clin Transl Hepatol. 2019;7(1):9-14. doi:10.14218/JCTH.2018.00043
- Swaroop S, Vaishnav M, Arora U, et al. Etiological spectrum of cirrhosis in India: a systematic review and meta-analysis. J Clin Exp Hepatol. 2024;14(2):101291. doi:10.1016/j.jceh.2023.10.002


Leave a Reply